
Steps:
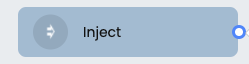
1. Select an Inject node under the Input section and then drag and drop it onto the white space. An inject node is basically what you would type in the google search bar if this was a google application.
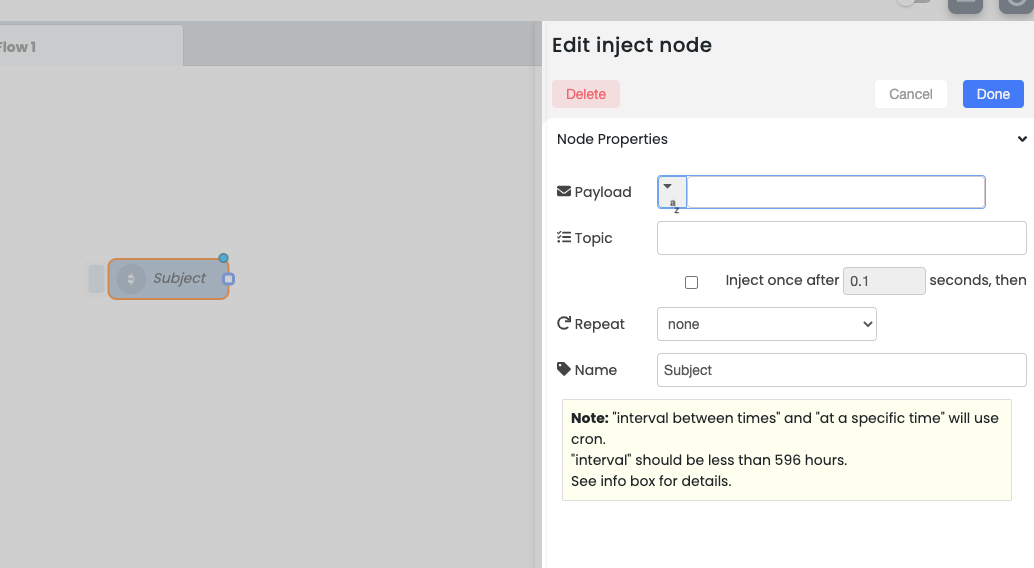
2. Edit the Inject node by double clicking on it. This will display attributes for that component. Enter the following:
Payload – String
Topic – Enter your desired topic, e.g. puppies
Repeat (i.e. how often you search for data) – None
Name – Subject
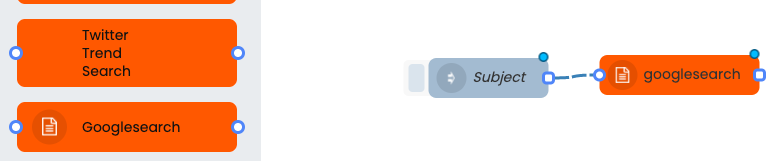
3. After the Inject node is selected, chose your Enterprise node. On top of the left hand navigation conduct an open search for ‘google search’. Drag and drop the selected node onto the white space.
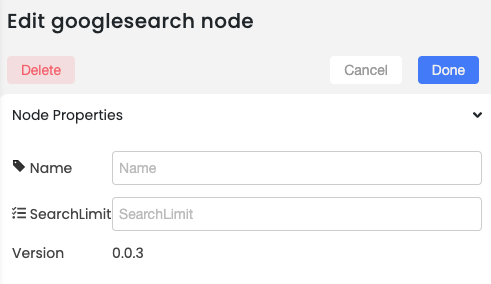
6. Double click on the enterprise node (in this case google search) and change the name (optional) and search limit (e.g. 30).
Note: These properties will vary depending on the node. Click Done once complete.
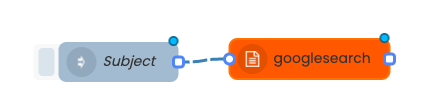
7. After the nodes are set up connect the nodes. Two do this click on the inject node and connect it to the google search.
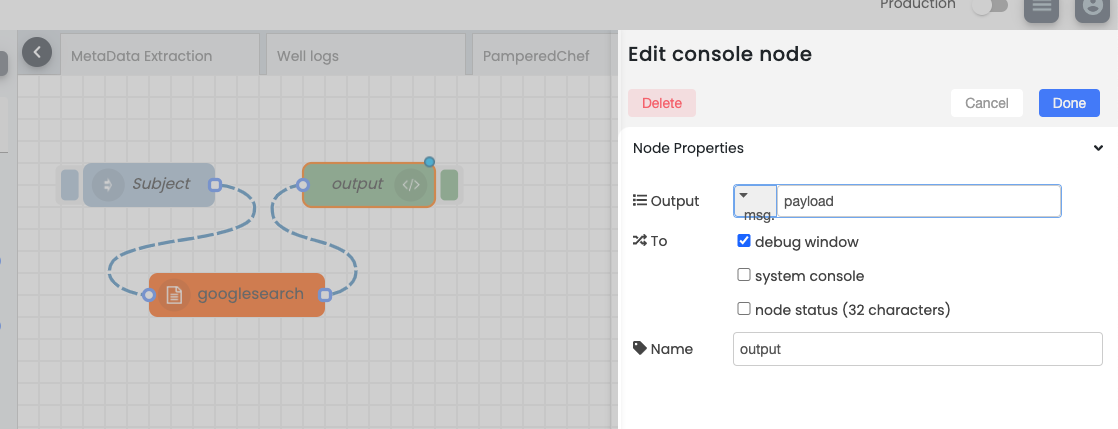
8. Lastly, select the console node. This will allow you to chose where you output the data. Double click on the console node and on the attributes section enter a Name (e.g. Output) and choose whether you want to send the output to the debug tab or the debug tab and console. Click Done.
9. Once the console node is updated, connect google search to console and run the code by clicking on the Deploy button on the right top corner. You’ll see a brief message pop us indicating “Successfully Deployed”
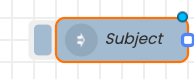
10. After the code is deployed click on the Inject node by clicking on the square icon next to the node.
This will run the selected subject (e.g. puppies) through the google search, and then google search scans the web and finds all websites for that subject. The green node then outputs all results to the screen on the right-hand side under the debug tab, which can be opened by click on the bug icon on the bottom menu.